


Ethereum price fell 2.6% toward $1,870 on Aug. 11 after another rejection below $1,950 triggered long liquidations, while traders reduced risk ahead of the latest U.S. inflation report.
Summary
- Ethereum price fell 2.6% toward $1,870 after buyers failed to sustain a move above $1,900.
- The daily RSI remains neutral at 51.63, but ETH is below three major moving averages.
- Liquidation clusters at $1,895 and $1,940 could amplify a recovery, while $1,857 anchors downside liquidity.
- Analysts identify $1,850 as the bullish invalidation level and $1,950 as the breakout threshold.
Ethereum price falls below $1,900
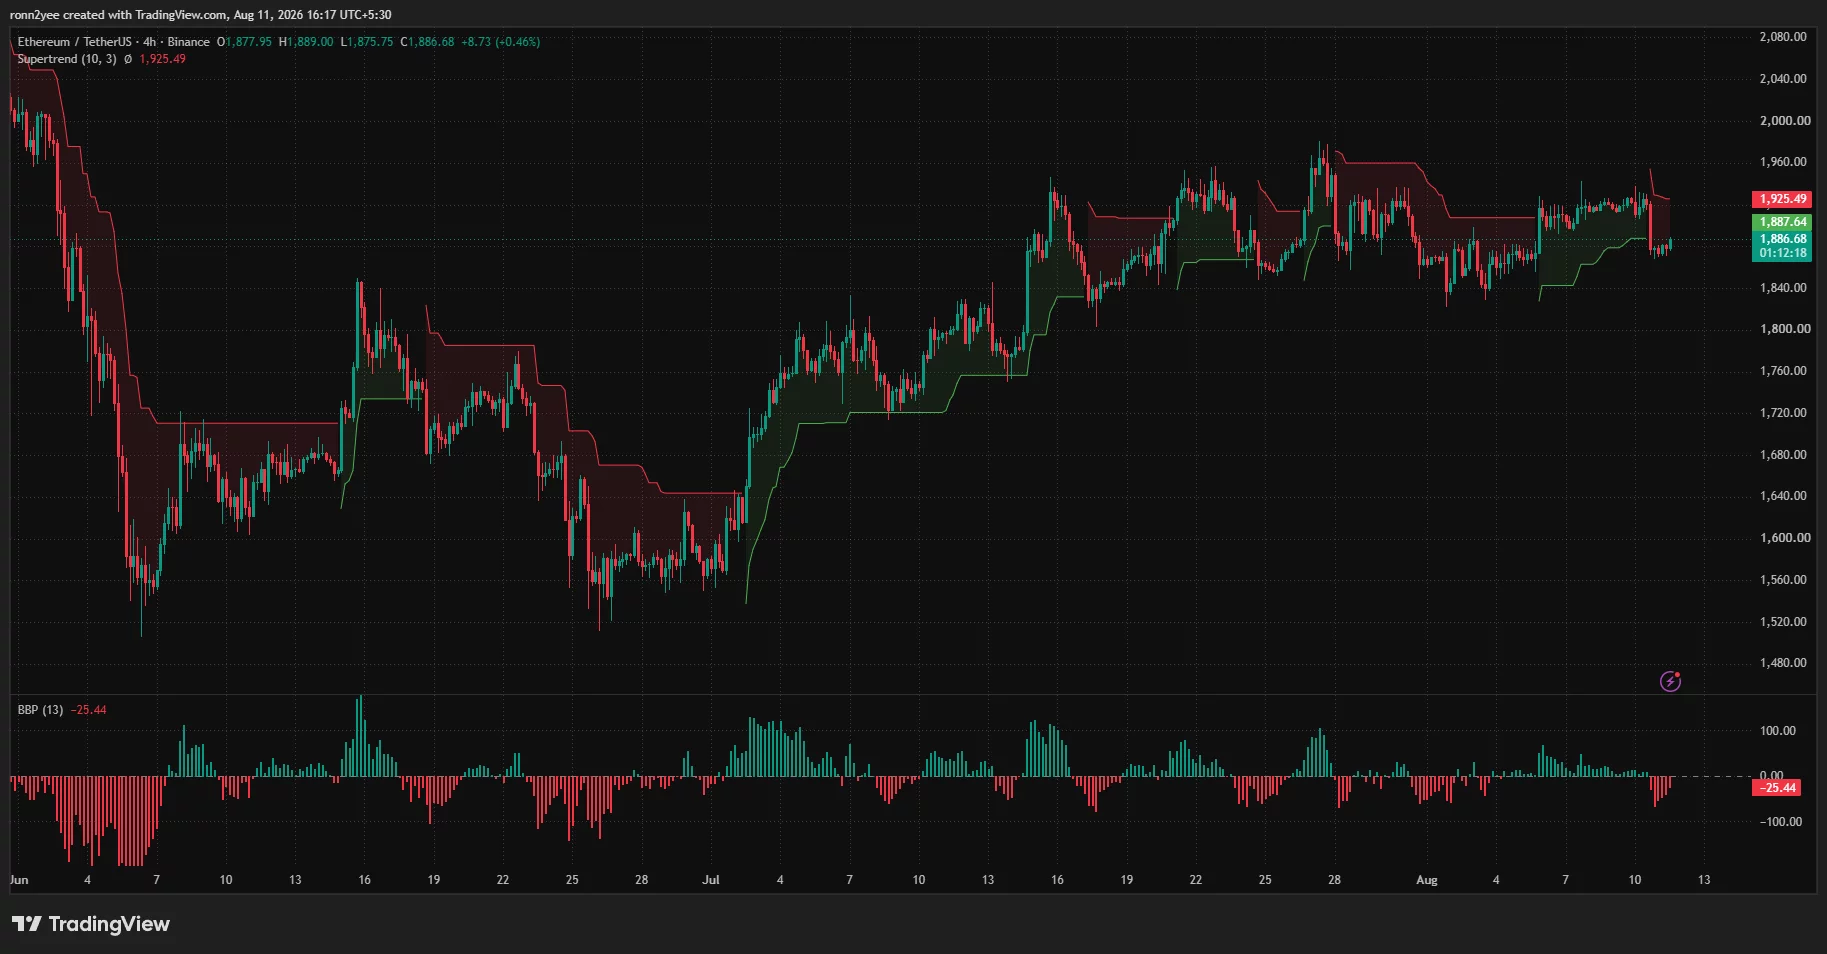
According to data from crypto.news, Ethereum (ETH) price traded near $1,870 during the latest session after sellers rejected another attempt to hold above the $1,900 psychological level. The decline extended from the Aug. 10 high near $1,935 and briefly pushed the token toward an intraday low of approximately $1,867.
ETH had recovered to around $1,886 by the time the accompanying charts were captured, reducing part of the daily loss. However, the rebound left the price below the short-term resistance area that has contained every advance since late July.
The decline follows several days of compression between roughly $1,850 and $1,950. Ethereum briefly approached the upper end of that range during the previous session, but buyers could not generate enough momentum to secure a daily close above $1,900.
That rejection reversed the setup observed one day earlier, when Ethereum had held $1,900 while traders watched liquidity near $1,950. The loss of $1,900 has now returned attention to the lower boundary of the range.
The 4-hour chart shows that ETH remains in a wider recovery from its late-June low near $1,520. Still, its recent sequence of higher lows has not produced a decisive higher high above the July peak near $1,970, leaving the market without a confirmed breakout.
Why Ethereum price is under pressure
The immediate pressure came from Ethereum’s failure to clear the $1,900–$1,950 resistance zone. Repeated rejections in the same area encouraged short-term traders to take profits, while the move below $1,900 exposed leveraged long positions opened in anticipation of a breakout.
The 4-hour Bull Bear Power indicator has fallen to -25.44, showing that sellers have regained short-term control. Negative readings do not guarantee an extended decline, but they show that buying pressure has weakened since ETH approached $1,930.
The 4-hour Supertrend has also flipped bearish, placing dynamic resistance at approximately $1,925. ETH would need to reclaim that level before the indicator supports another move toward $1,950.
Broader risk appetite remains cautious before the July U.S. Consumer Price Index report. The Bureau of Labor Statistics will publish the data on Aug. 12 at 8:30 a.m. Eastern, making it the next major macroeconomic catalyst for U.S. crypto traders.
A hotter-than-expected reading could support a higher-for-longer Federal Reserve policy outlook and pressure speculative assets. Softer inflation, by contrast, could improve liquidity expectations and help ETH challenge its overhead resistance.
Rising energy prices have added uncertainty to that outlook. Higher oil costs can feed into headline inflation and complicate expectations for future U.S. interest-rate decisions, although the direct effect on Ethereum will depend on the CPI result and the market’s response.
ETH liquidation map points to $1,895 and $1,940
The 3-day CoinGlass liquidation heatmap shows a dense concentration of leveraged positions near $1,895, just above Ethereum’s current price. This is the closest major upside liquidity pool and could attract price if ETH’s recovery continues.
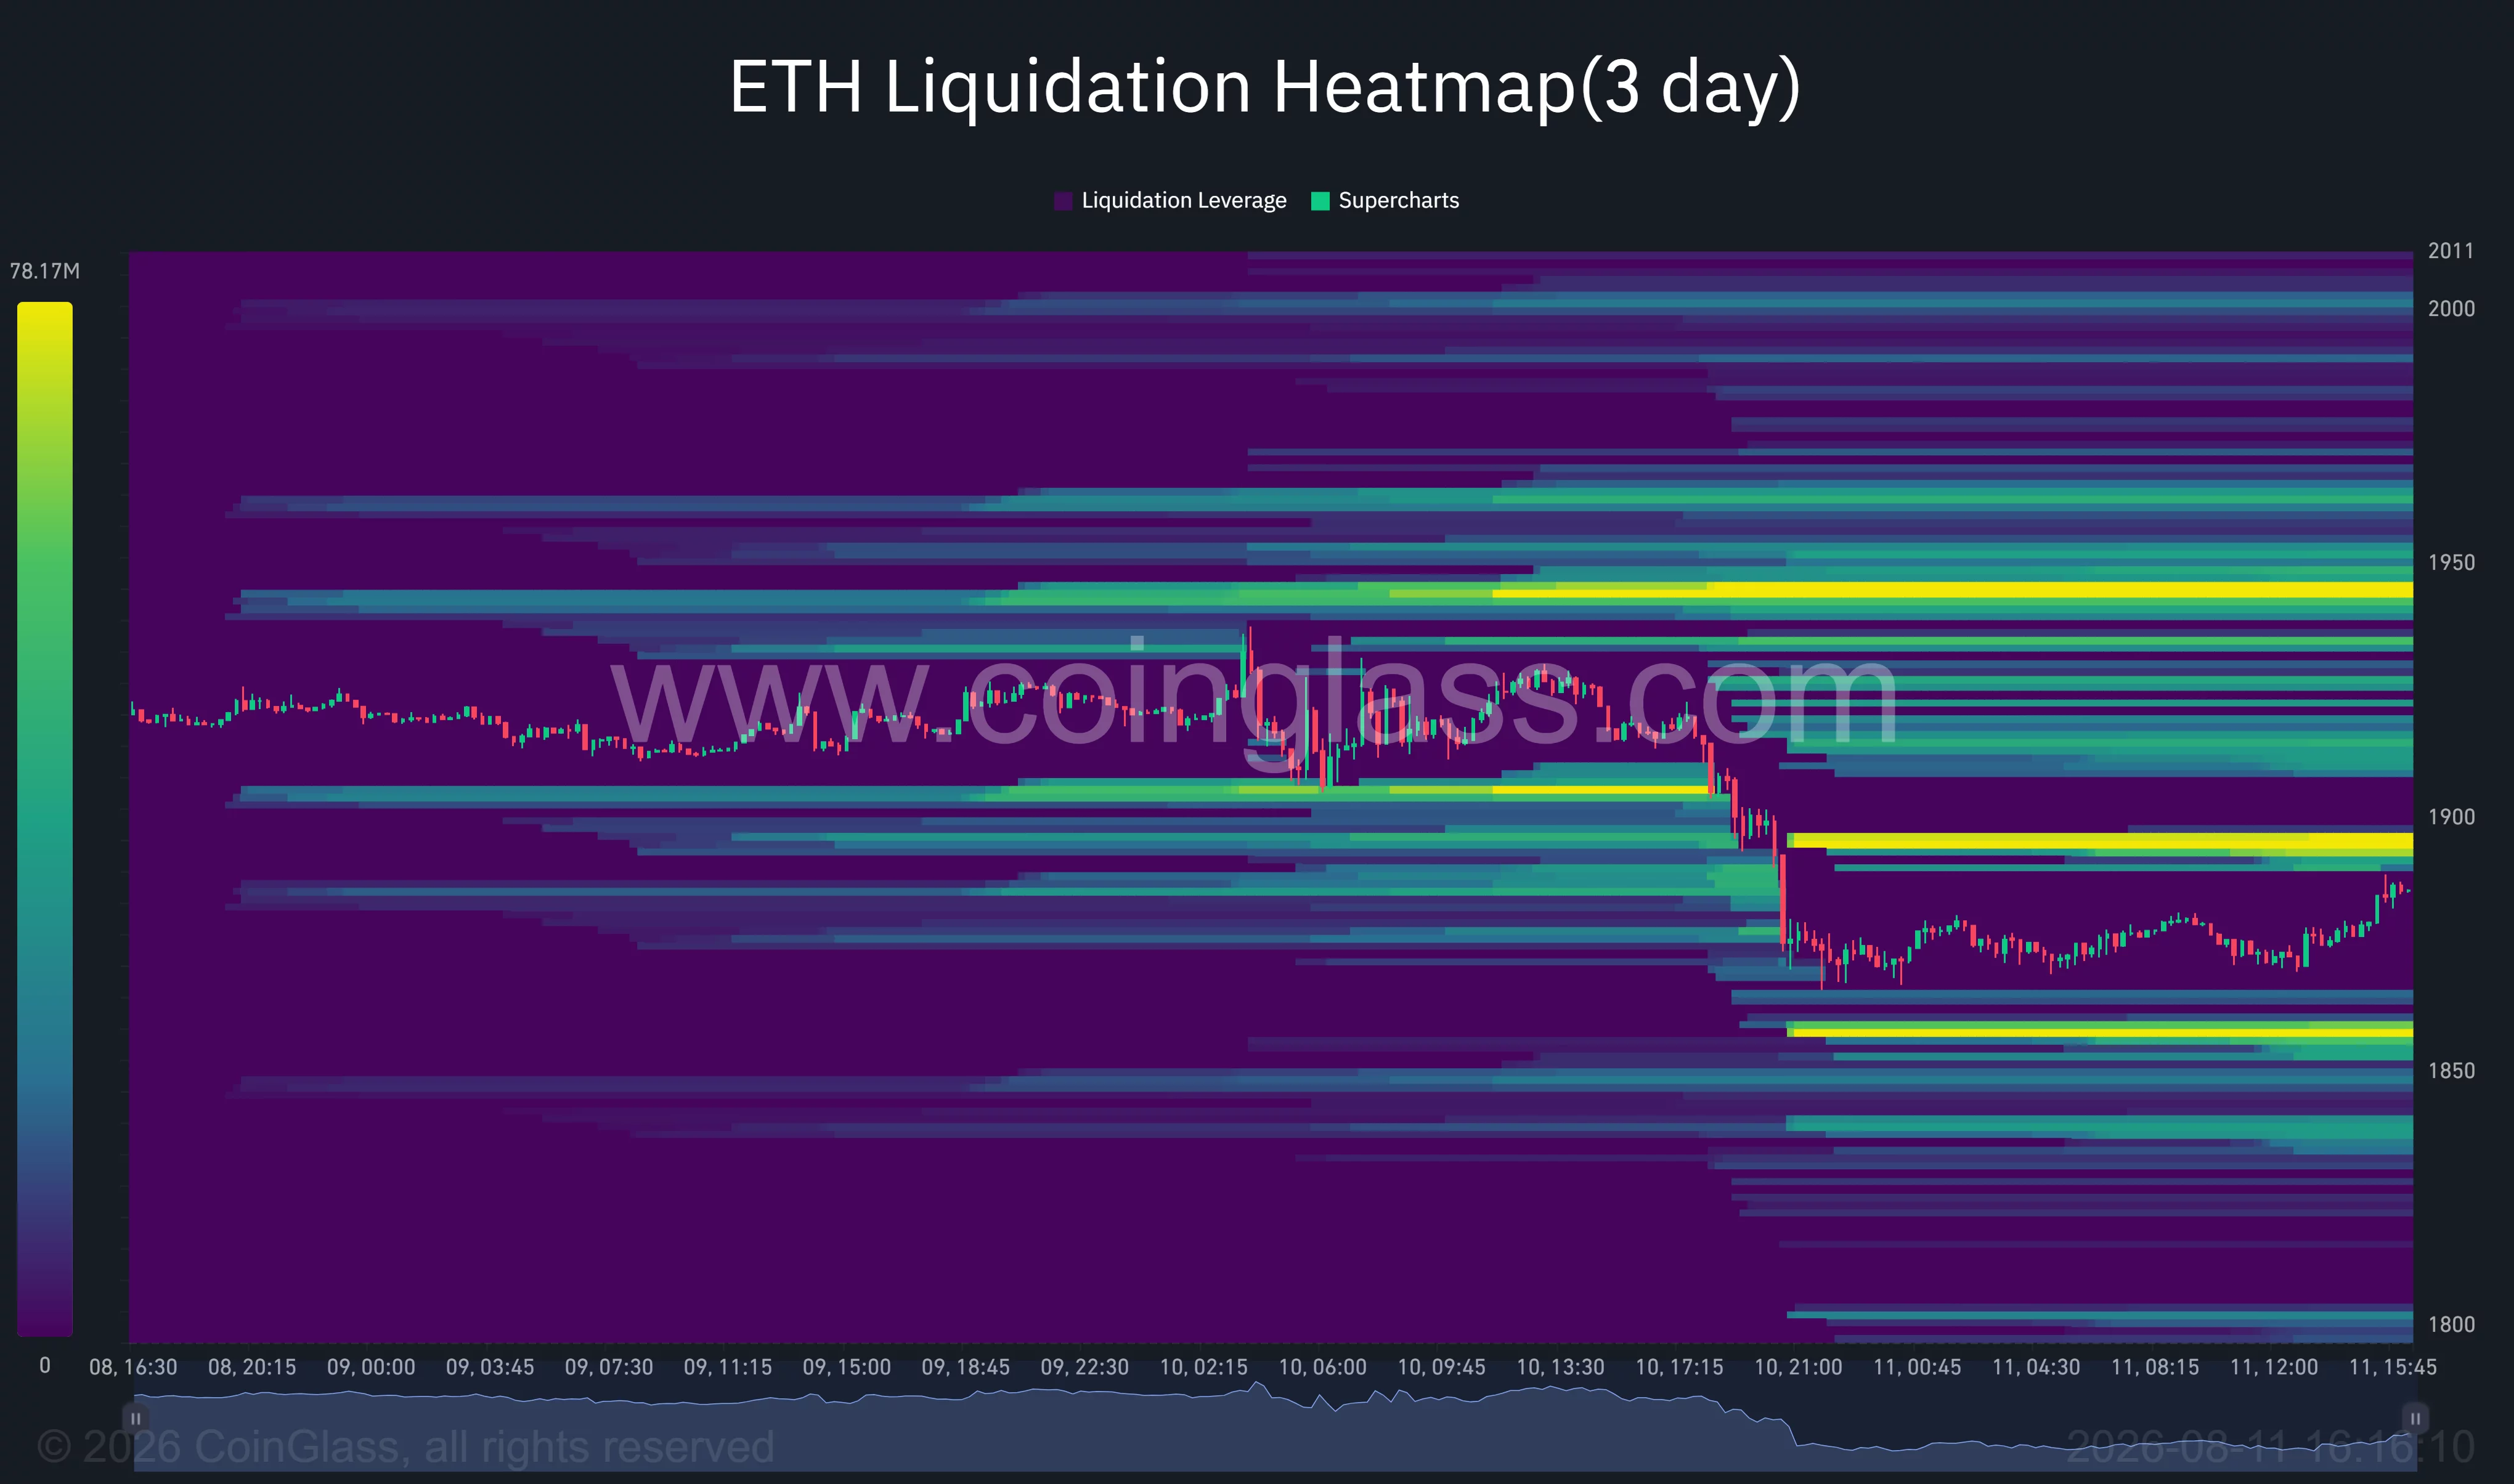
A move through $1,895 could liquidate nearby short positions and accelerate a return above $1,900. The resulting forced buying may then expose smaller liquidity bands between approximately $1,915 and $1,930.
The strongest overhead concentration appears near $1,940. That level sits inside the same resistance zone that stopped Ethereum’s recent advances, making it both a technical barrier and a potential short-squeeze target.
Downside liquidity is concentrated around $1,857. A decline into that area could trigger another wave of long liquidations before buyers attempt to defend the broader $1,840–$1,850 support zone.
The heatmap therefore places ETH between two nearby leverage targets. Price compression within this structure raises the chance that a break on either side produces a sharper move as exchanges close positions caught offside.
Ethereum technicals keep $1,850 in focus
Ethereum’s daily chart presents a mixed setup. ETH is trading below its 20-day simple moving average at $1,892.52 and its 100-day average at $1,895.32, creating immediate resistance around $1,890–$1,900.
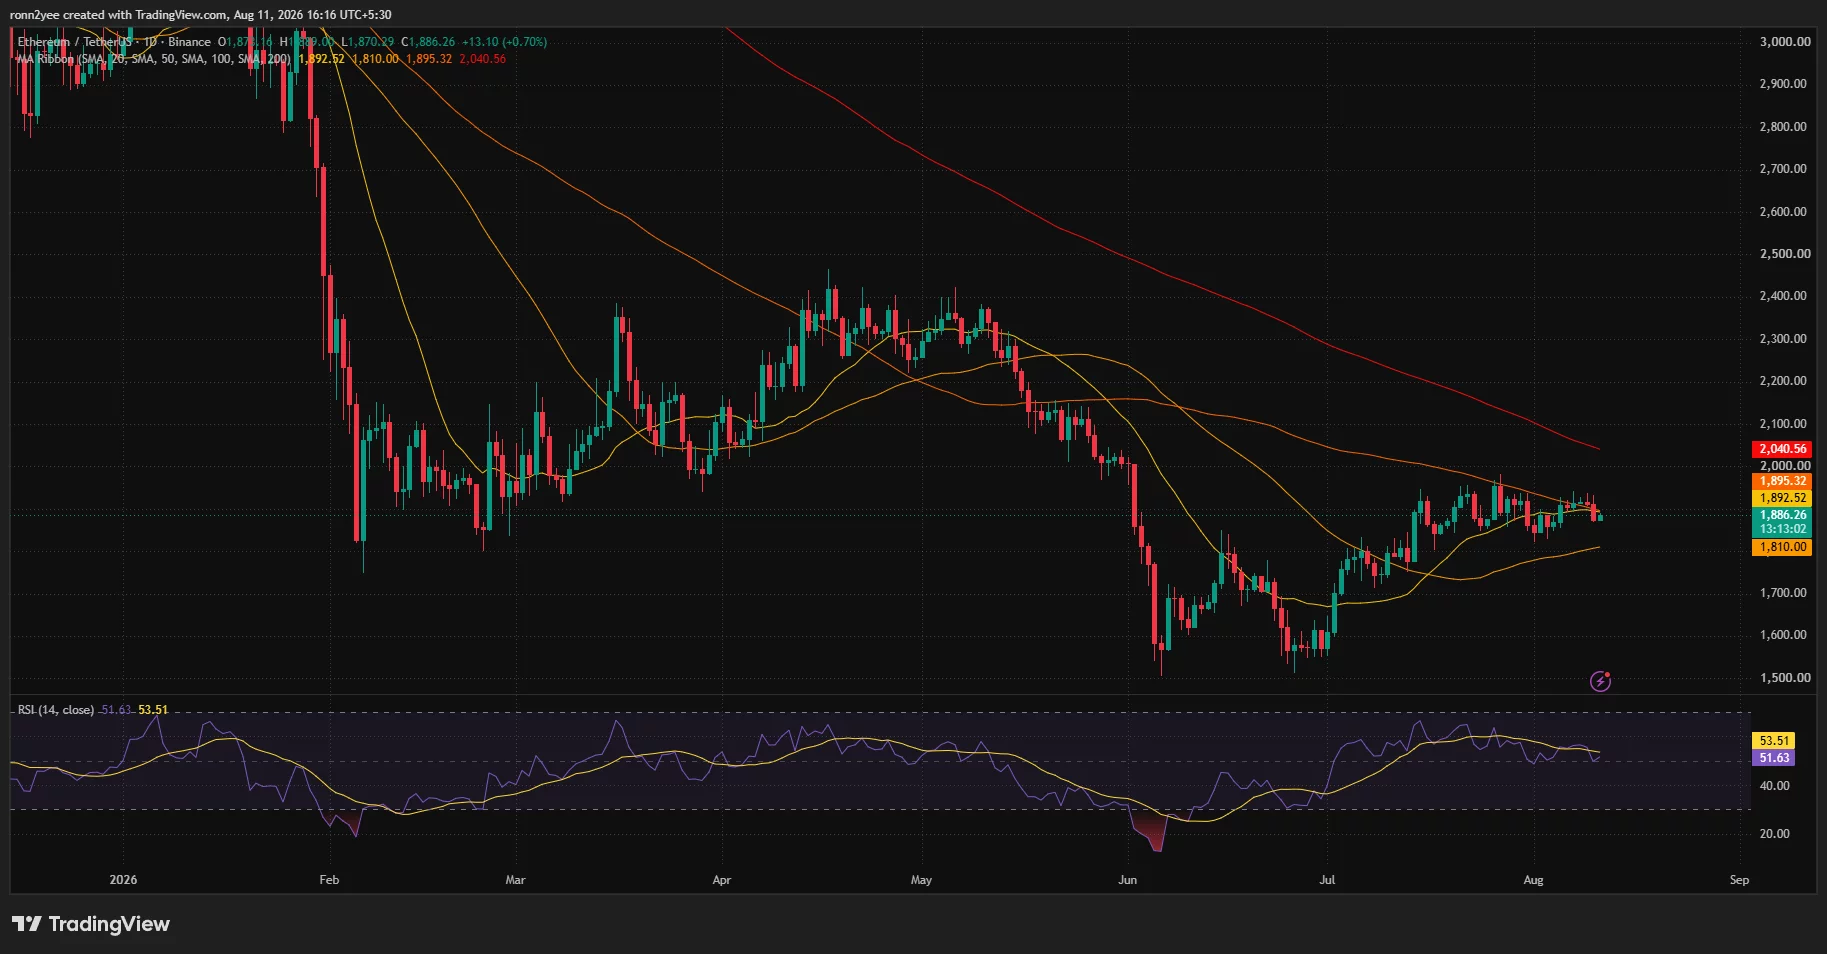
The token also remains well below the 200-day SMA at $2,040.56. That long-term average would become relevant only if ETH first breaks $1,950 and then establishes support above $2,000.
The 50-day SMA at $1,810 provides the closest major dynamic support below the current range. Its upward slope reflects the recovery from June, but a move toward that average would confirm that the $1,850 floor had failed.
Daily momentum remains neutral rather than deeply bearish. The Relative Strength Index stands at 51.63, slightly below its signal average of 53.51. That reading gives sellers some short-term control without placing Ethereum near oversold conditions.
Analyst Ted Pillows identified $1,850 as a must-hold area if Ethereum is to produce another push above $1,900. His chart places subsequent upside levels near $2,000 and $2,190, while a confirmed loss of the current support could open a decline toward $1,700 and eventually the $1,550 region.
Daan Crypto Trades offered a similar range assessment, arguing that ETH must break and hold $1,950 to open a move above $2,100.
“Especially seeing how compressed price has been here, a breakout (to either side) should come with a decent squeeze of positions that are caught offside.”
He also marked $1,850 as the bullish invalidation level. Together, the two assessments establish a clear short-term structure: $1,850 controls the downside, while $1,950 separates continued consolidation from a stronger recovery.
U.S. CPI could decide Ethereum’s next move
Institutional demand provides some support despite the short-term price weakness. U.S. spot Ethereum ETFs attracted approximately $244.9 million during the week ended Aug. 7, according to recent flow data.
Those inflows challenge the idea that institutional investors have completely withdrawn from ETH. However, ETF demand has not yet been strong enough to force a breakout through the $1,950 resistance area.
The next directional move may depend on whether U.S. inflation data strengthens or weakens the dollar and Treasury yields. A favorable response could help Ethereum reclaim $1,900 and target the $1,925 Supertrend level, followed by the $1,940–$1,950 liquidity zone.
Failure to recover $1,900 would keep ETH vulnerable to another test of $1,857 and $1,850. A daily close below that support would expose the 50-day SMA near $1,810, while sustained selling could place the July consolidation area around $1,700 back in focus.
For now, Ethereum remains compressed between a well-defended floor and heavy overhead supply. The reaction at $1,850 or a confirmed break above $1,950 will provide stronger evidence of the market’s next trend.
Disclosure: This article does not represent investment advice. The content and materials featured on this page are for educational purposes only.
