


Bitcoin has slipped to around $75,800 on Nov. 6, leaving buyers defending $75,000 as weak daily momentum challenges analysts’ expectations of a recovery toward $81,000–$82,000.
Summary
- Bitcoin traded near its lower daily Bollinger band, with RSI below neutral at 37.82.
- The weekly chart showed a brief drop below the $75,000 pivot before buyers recovered it.
- Liquidation clusters appeared above $76,000 and below $75,000, leaving leverage exposed in both directions.
- Ted Pillows identified buying interest at $73,000–$75,000, while Crypto Patel illustrated a deeper pullback scenario.
According to the daily chart, Bitcoin traded at $75,798.85 at press time on Nov. 6, down 0.4% during the daily session. Prices had ranged between $74,888 and $76,416.24, leaving the recovery from the session low short of reclaiming $76,000.
Earlier in the day, Bitcoin briefly recovered above $76,000 after Thursday’s selloff. By the evening chart snapshot, it had fallen below that level again, keeping attention on whether buying around $75,000 could support a more lasting recovery.
Bitcoin needs to recover its daily average
On the daily chart, Bitcoin remained below the middle Bollinger band at $79,759.25, with the lower band at $75,085.29 and the upper band at $84,433.20. Its position near the bottom of that range followed a sequence of lower highs since October.
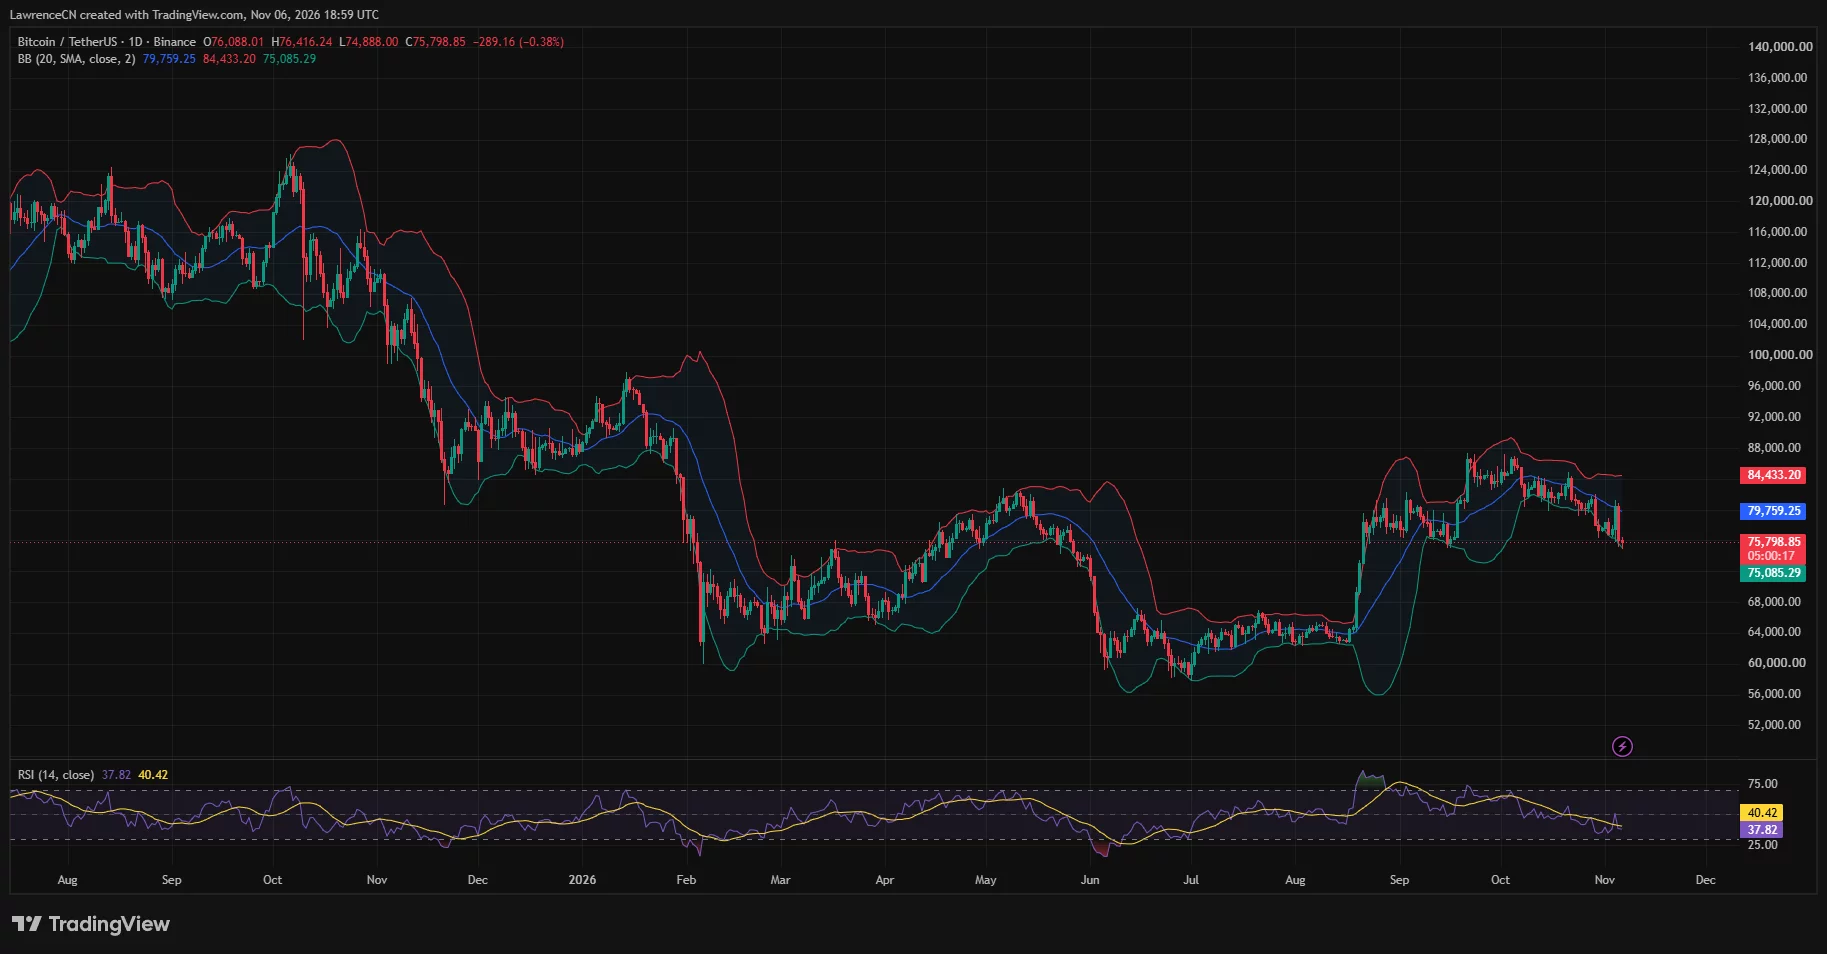
The daily relative strength index stood at 37.82, beneath its average of 40.42. Selling momentum remained stronger than buying momentum, although the reading was still above the conventional oversold threshold of 30.
A move back to the middle band would require a gain of roughly 5.2% from the chart price. Recovering that average would carry Bitcoin beyond the latest session high and back toward $80,000, where its earlier rebound had failed to hold.
The weekly chart showed Bitcoin at $75,796, down 3.26% from the weekly opening price of $78,354.01. During the still-open candle, BTC had reached $81,196.01 before retreating to $74,888.
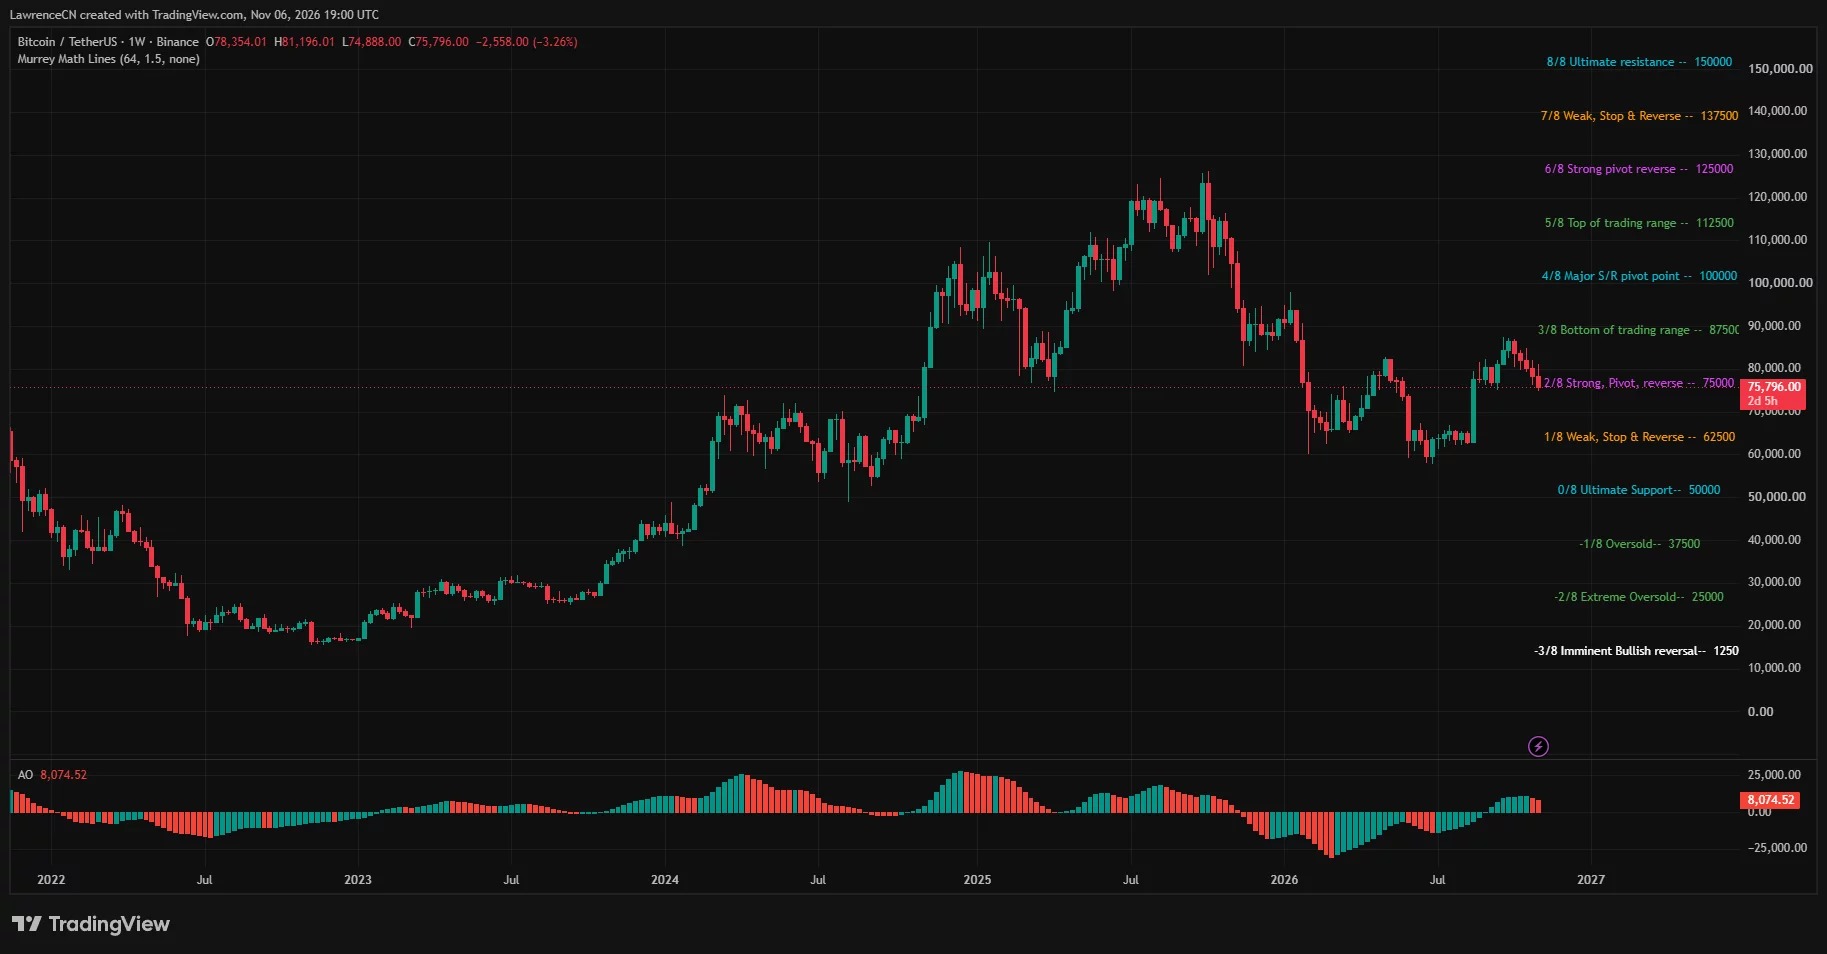
Its latest price sat just above the $75,000 Murrey Math pivot. The next labeled levels on that indicator were $87,500 above and $62,500 below, although the daily chart and liquidation map contained closer levels.
The weekly candle still had more than two days remaining, leaving its final close above or below the pivot unresolved at the snapshot.
Weekly momentum offered a mixed reading. The Awesome Oscillator remained positive at 8,074.52, but its latest bars were red, showing that positive momentum had weakened as the weekly price declined.
Liquidation clusters surround the $75,000 defense
CoinGlass’s 24-hour liquidation heatmap showed prominent overhead concentrations near $76,300 and $76,600, with further clusters around $76,900–$77,100. Below the market, concentrations appeared near $74,800 and across $74,500–$74,700.
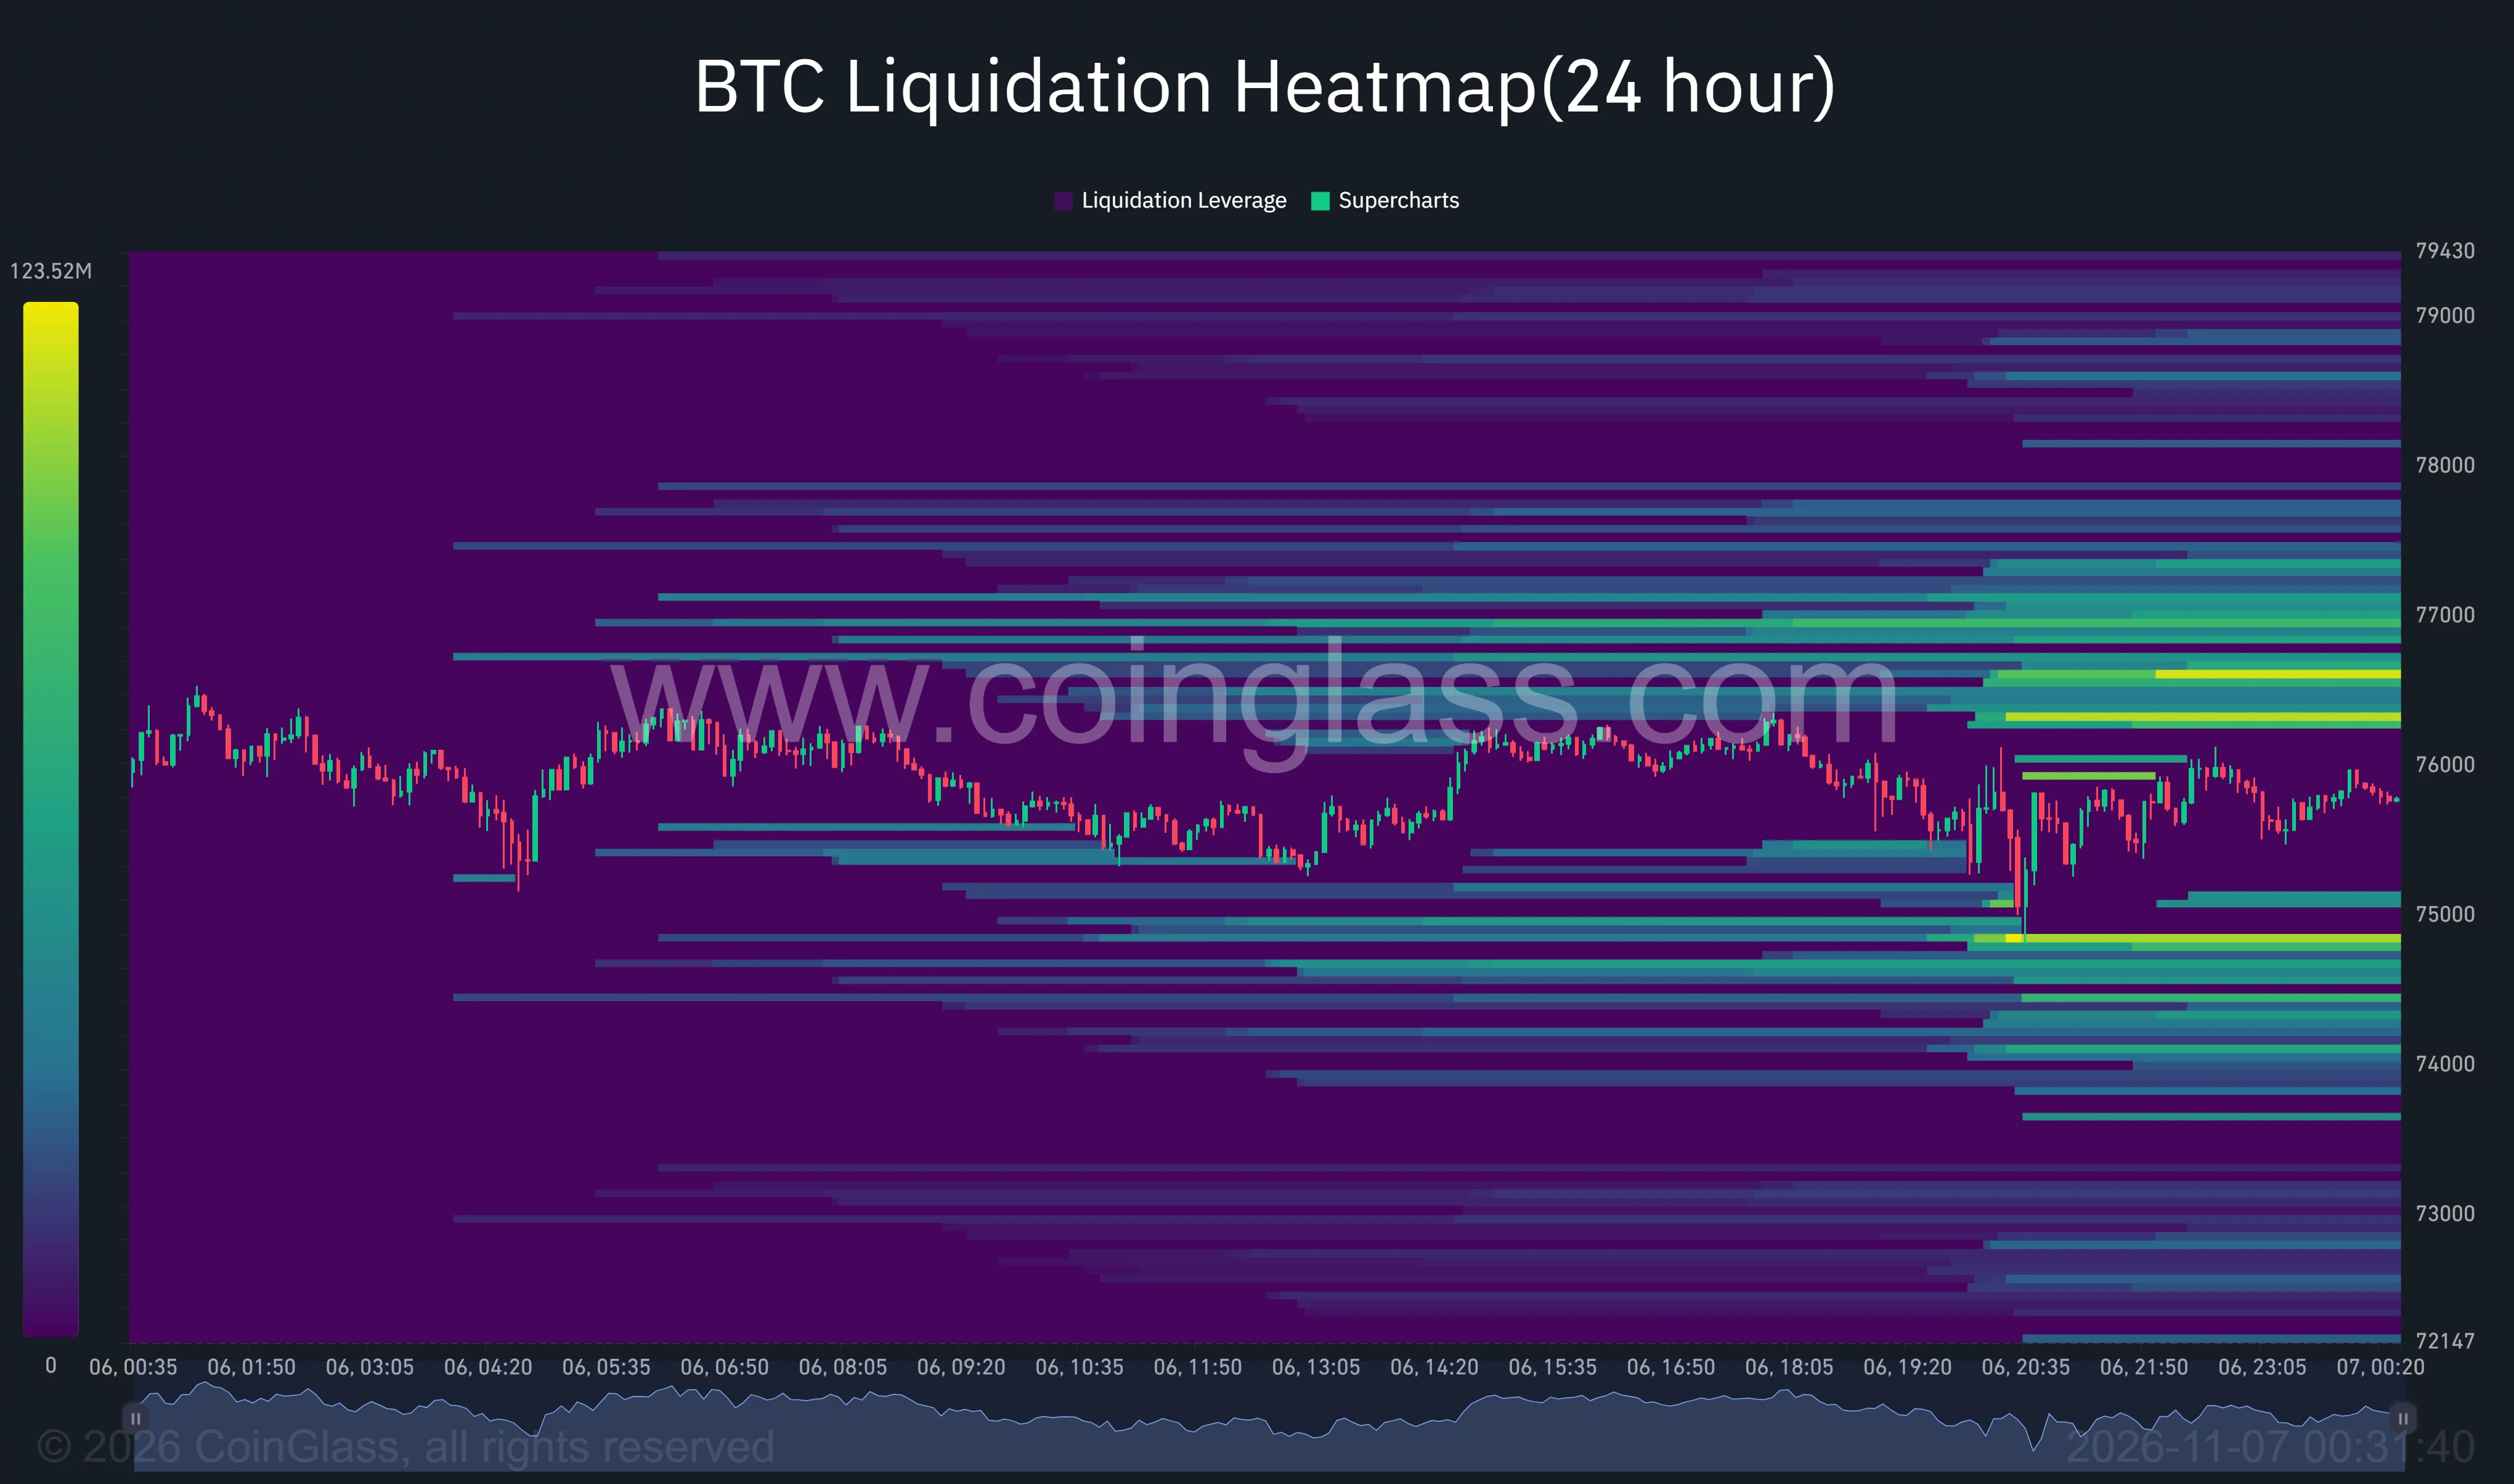
The map showed Bitcoin briefly falling below $75,000 before bouncing. A return to the overhead clusters could expose short positions to liquidations, while renewed selling below support could reach leveraged long positions.
In a Nov. 6 post, analyst Ted Pillows described large buy orders around $73,000–$75,000 and said major sell orders were concentrated farther away at $81,000–$82,000.
“Downside looks limited now, and a pump could happen,” he wrote.
His order-book assessment favored a rebound, but the daily chart still placed its moving average below that selling zone. From $75,798.85, reaching $81,000 would require roughly 6.9%, while $82,000 would require approximately 8.2%.
Crypto Patel’s Nov. 6 chart illustrated a different route. Its projected path allowed Bitcoin to fall toward approximately $68,000 before recovering substantially. The annotated setup therefore left room for further losses before its bullish recovery scenario developed.
ETF withdrawals follow a failed rebound
The support test followed renewed withdrawals from U.S. spot Bitcoin ETFs. As crypto.news previously reported, the funds recorded $430.2 million in outflows on Nov. 5, reversing the previous session’s $74.6 million intake.
Fidelity’s FBTC led Thursday’s withdrawals with $199.9 million, followed by $105 million from BlackRock’s IBIT. The change followed a brief return to buying on Nov. 4, when Fidelity attracted $236.7 million even as BlackRock lost $201.2 million.
Selling had already interrupted the late-October inflow streak. Farside Investors recorded $643.2 million in withdrawals on Oct. 30, exceeding the $440.8 million collected over the preceding four sessions.
Across Nov. 2–5, the daily totals amounted to $869.8 million in net withdrawals. Grayscale’s GBTC lost $49.9 million during the Nov. 5 session, Franklin Templeton’s EZBC shed $32.9 million, and VanEck’s HODL recorded $23.6 million in outflows.
